Skip to content

Year: 2017

SQL Server Reporting Services vs Power BI Report Server – What’s the Difference?

Power BI Report Server (PBIRS) was first introduced in May 2017. Based on SQL Server Reporting Services (SSRS), it brings the ability to work with Power BI reports completely on premises in addition to all the other capabilities of SSRS. Given this, it would be reasonable to conclude that PBIRS was the next version of, or a replacement for SSRS, but that is not the case. I have heard people state that SSRS is “going away”, but this is simply not the case. SSRS is still a core part of the Microsoft BI stack. So, what are the differences between the two platforms? The differences boil down to features, licensing, and update cadence.

Features

Early builds of SSRS 2017 (V.Next at the time) contained the ability to render Power BI (Interactive) reports in addition to the “classic” RDL (Paginated) reports that SSRS is well known for and the recently added RSMOBILE (Mobile) report types. However, when PBIRS was introduced, SSRS lost that capability, and from a feature standpoint, it really was the only difference between the two. The recent introduction of the Excel report type (Analytical) to PBIRS has further differentiated the two products.

From a features standpoint, the differences between the two products are straightforward. PBIRS is a superset of SSRS. It contains everything that SSRS has, and it ads the ability to render both Interactive (PBIX) and Analytical (XLSX) reports.

Licensing

Licensing is where things get a little more involved. SSRS was always included on the SQL Server installation media, but with SQL Server 2017, this is no longer the case, it’s a separate download (the RC version of SSRS 2017 is currently available for download here). However, the license for SSRS is still tied to your version of SQL Server. Therefore, if you have a license for Standard mode SQL Server, you will be able to use the Standard mode features of SSRS, Enterprise unlocks the Enterprise features, etc. As of the 2017 version, there is also no longer an Integrated mode of SSRS, it’s Native Mode only.

Power BI Report Server is licensed in one of two ways. Purchasing Power BI Premium capacity gives you a license to run the same number of cores as you have in the capacity. This ONLY applies to Premium P SKUs, not any others such as EM. The other way that it can be licensed is by purchasing SQL Server Enterprise Edition + Software Assurance.

Release cadence

Just as with licensing, the timing of releases of SSRS is also tied to that of SQL Server. Whenever a new version of SQL Server is released, a new version of SSRS will be as well. This is not the case for PBIRS. Since PBIRS is considered a standalone product this makes sense, and the constant pace of change in the Power BI service itself necessitates a more frequent update cadence.

As an example, PBIRS first came into General Availability (GA) in June 2017, and as of this writing (Sept 2017) is already in preview for its next release, whereas SSRS 2017 hasn’t yet gone to GA.

How to choose

The choice between which platform to use will likely be straightforward and likely driven by requirements. If your organization only uses paginated reports on premises, you may find that SSRS is a more cost-effective option. If, on the other hand you have the need to render interactive or analytical reports on premises, or you already have SQL Server Enterprise Edition with Software Assurance, then PBIRS will likely be your best choice. There are no circumstances that I can think of where both products will be advisable, if you have PBIRS, you have everything that SSRS offers and more.

15 Comments
Which Premium SKU is Needed to embed Power BI Reports in SharePoint and Microsoft Teams

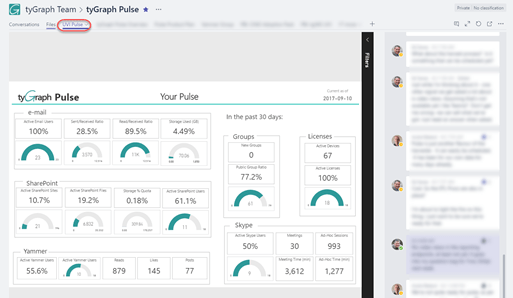
A short time ago, I posted an article explaining the difference between a Power BI Pro license, and Power BI Premium capacity, and the fact that you’ll at least need one or the other in order to share a Power BI report on a SharePoint page via the Power BI web part. Although that article didn’t mention it, the same requirement is also true for embedding a report in a Microsoft Teams tab.

Power BI Report embedded in a Microsoft Teams tab

Power BI Report embedded in a SharePoint Page

Since there are two major SKU types for Power BI premium, and that there was (and is) a fair amount of confusion around this area, I also published another article attempting to clear up the confusion. While this article was based on all the information publicly available at the time, new information has pointed out that it is incorrect.

The two major SKU types are P and EM, with P standing for Premium and EM for Embedded. This matters significantly because the two SKU types have significantly different entry points and therefore costs.

The P SKU was the only one introduced when Premium was originally announced. It gives organizations the ability to place Power BI assets in a premium capacity container (a Power BI “app”), and once this is done, anyone can consume these assets whether or not they have a license.

Subsequent to this, an additional SK (EM) was introduced to address Power BI Embedded. Power BI embedded allows an ISV to use Power BI to add reports to their own applications. In this scenario, the reports run from the ISV’s tenant. Originally the assets were housed in Azure, but with the availability of Premium capacity, the decision was made to shift Power BI Embedded to use this new model. Given that the requirements of an ISV are not the same as a general organization, this new  SKU was introduced. The EM SKU comes with a significantly lower entry point and cost, but also with significant restrictions. This is where the confusion sets in.

The wording around the restrictions on the EM SKU indicated that it could not be used for the SharePoint web part, and that a P SKU, or a Pro license would be required for that use case. This is where my earlier article is incorrect. I have since had conversations with the product team, and have been informed in no uncertain terms that the EM SKU CAN be used for both SharePoint web part, and Teams tab embedding of Power BI reports.

This is a very significant difference. An organization that is using Power BI casually, but has a few reports that they want to share with a broad audience was looking at a cost of almost $5,000 per month to do this. Given that the cost of a Pro license is $10/user/month, this meant that the organization needed to have at least 500 frequent report consumers before Premium was even worth considering. Also given the fact that the embedding features available in both SharePoint and Teams require that Pro or Premium SKU, this could be a real disincentive to its use. However, given that the EM SKU start at approximately $650/month for the entire organization, this becomes much more approachable, and it lowers the bar to entry significantly. This should result in significantly greater adoption of these Power BI embedding features, and consequently, of Power BI as a whole.

To be clear, there are still restrictions around the EM SKU. You cannot share Power BI apps with this SKU, but you CAN use it to embed reports in both SharePoint and Microsoft Teams.

8 Comments

Power BI Report Server Completes the Vision for On-Premises Reporting

Microsoft today made available the August 2017 preview of Power BI ReportServer 2017. This preview includes the long awaited support of embedded data models, as well as the ability to render Excel reports natively. This is a major step forward, because with this release, Microsoft has completed its vision for its on-premises reporting platform that it first articulated in October of 2015.

Excel content being rendered in Power BI Reporting Server

The big news at the time was that the platform was stated to be SQL Server Reporting Services (SSRS). Not SharePoint, not PerformancePoint, but SSRS. SSRS was a mature product that quite competently provided a platform for operational reports. What it needed was some modernization and the addition of some analytical and self-service reporting capabilities. Several of these capabilities were subsequently included with the release of SSRS 2016.

Gone would be the days of configuring complex SharePoint farms just to be able to work with analytical reports (ie Power View, Excel). New Features were being added to SSRS to make it a complete platform for both analytical and operational reports.

The Vision

The roadmap articulated four different report types, 3 of them analytical (by my definition) and one of them operational. These three types line up with reporting tools in the Microsoft BI stack:

Name Type Primary authoring tool ext
Paginated Operational SSRS Report Builder
SQL Server Data Tools
.RDL
Interactive Analytical Power BI Desktop .PBIX
Mobile Analytical Mobile Report Designer .RDLX
Analytical Analytical Excel .XLSX

Therefore, reading between the lines, in order to be a complete reporting platform, SSRS needed to be able to render all of these report types. Paginated reports were of course always native to SSRS, and the roadmap announced that Mobile reports would be included in SSRS 2016 through the integration of Datazen. The roadmap further committed to SSRS being able to render Power BI files in the future.

SSRS 2016

SSRS shipped with some significant modernization improvements, including a much awaited HTML5 rendering engine, and it included Mobile Reports. Mobile reports are delivered through the Power BI mobile application, and SSRS visuals can be pinned to Power BI dashboards.

Significant plumbing was done to move the platform forward in 2016, but it still only rendered 2 of the 4 report types.

In November 2016, it was further announced that the 2016 version of SSRS running in SharePoint Integrated mode would be the last. Moving forward, Reporting Services will only run in Native Mode. In the same announcement. In the same announcement, as I noted in another post, for the first time, the SSRS team committed to providing Excel report rendering capability as well.

Power BI Reporting Server

We first saw the on premises rendering of Power BI reports in the first community preview of SSRS V.Next in the fall of 2016. Those previews required that the reports be directly connected to SSAS tabular models, but they were ground-breaking just the same. A user could be totally disconnected from the web, and still render Power BI reports.

In May of 2017, Power BI Report Server (PBIRS) was announced. A less confusing name could have potentially been SSRS Premium, because that is in essence what it is. PBIRS is everything that SSRS is, plus the ability to render Power BI reports. SSRS will continue forward as a product without Power BI rendering capabilities. It is just a licensing distinction.

The release today of the August 2017 preview of PBIRS allows for embedded data models, and therefore a much wider breadth of capabilities. These models cannot be automatically refreshed yet, but they will upon release. This is, after all, just a preview. If you need automatic refresh of these data models in the meantime, there is an excellent third party solution to do this: PowerPivot Pro’s Power Update.

The inclusion of Excel report rendering capabilities means that PBIRS is a complete report rendering platform, more complete even that the Power BI cloud service.

Moving Forward

Now that the basic on-premises capability has been provided, SSRS/PBIRS needs to pay attention to paying back the debt that it incurred when SharePoint Integrated mode was deprecated. Chief among these features is the SSRS web part. The lack of a decent web part is a blocker for many organizations to move forward with this strategy. Some migration tools to move from Integrated to Native mode (like this one that migrates in the other direction) would be highly useful as well.

Now with on-premises covering all the bases, it’s easy to spot a glaring hole in the cloud Power BI offering. While it supports all three types of analytical reports, there is currently no way to render operational reports in the cloud. Until this capability is provided, it appears that on-premises will have the most complete solution.

2 Comments

Power BI Embedded is not for Embedding Power BI Reports

NOTICE Sept 17 2017 – The central thrust of this post is incorrect. I am leaving it here, because it still contains valid information, but for an update, please go to this article –  Which Premium SKU is Needed to embed Power BI Reports in SharePoint and Microsoft Teams

I have run into this point of confusion several times since the GA of the Power BI Premium SKU. As I mentioned in my post about licensing, the Power BI web part for SharePoint requires the user viewing the report to have a Pro license. Alternatively, if the organization has purchase Power BI premium capacity, and the report has been deployed to that capacity, then all organizational users will be able to view the report in the web part.

The initial announcement about Premium licensing laid out 5 different SKUs for premium, P1, P2 and P3. These SKUs are the “normal” SKUs that are intended to be used by Power BI customers. The “P” stands for Premium. Subsequently, 3 additional SKUs were announced at the Data Insights summit to be used by ISVs. These SKUs are EM1, EM2, and EM3. The “EM” stands for embedded. The embedded in this case means Power BI embedded. That’s where the confusion sets in.

Power BI Embedded is the ISV offering for Power BI. With Power BI embedded, software vendors can use Power BI as the reporting engine in their application. A number of vendors have taken advantage of this capability in the recent past including Nintex with their Hawkeye product, and ourselves with tyGraph for Yammer Reporting. With Power BI embedded, all of the processing for the application is done in the vendor’s Power BI tenant. Customers don’t require a Power BI license of any sort to use the applications. Recently, Power BI embedded has moved to a premium model as well, which is why the EM SKUs exist. They are for purchase by software vendors to power their own applications.

If we have a look at the pricing for each of these SKUs (in $US/month), we can see that the EM SKUs are significantly cheaper, but they also come with the important restriction that they can ONLY be used by ISVs.

Capacity Node Cores Back end cores Front end cores

Cost

P1 8 4 cores, 25 GB RAM 4 cores

$4,995

P2 16 8 cores, 50 GB RAM 8 cores

$9,995

P3 32 16 cores, 100 GB RAM 16 cores

$19,995

EM1 1 0.5 cores, 3 GB RAM 0.5 cores

$625

EM2 2 1 core, 5 GB RAM 1 core

$1,245

EM3 4 2 cores, 10 GB RAM 2 cores

$2,495

It may be natural to think that because your goal is to “embed” a Power BI report in SharePoint, that you will be able to use one of the cheaper, “embedded” SKUs. Microsoft loves to overload terms when they name things, and this is one of those times that this tendency leads to confusion. Make no mistake, in order to embed a Power BI report in a SharePoint page, and to have other users be able to view it, you will need to have a Pro license, and your users will either need Pro licenses as well, OR your organization will need to have purchased a Power BI Premium “P” SKU, not an “EM” SKU.

5 Comments

What License is Needed to Use the Power BI Web Part?

The Power BI web part is now a part of SharePoint online for the majority of Office 365 users. This web part allows Power BI reports to be embedded on SharePoint pages, putting them in greater context. These web parts are rendered on the client, not on the server like old style web parts, which means that they are rendered by the consuming user, not the server. This means that in order for the report to render properly, the user needs to not only have access to the report, but also needs to be licensed for it.

The Power BI web part is a feature that requires a Pro license for both producers and consumers. This actually makes sense given that any sharing features in Power BI require Pro. Also, given that the consuming user must have access to the report, the report will be contained in a Group workspace, and Group workspaces themselves require a Pro license. So, what happens when a non Pro user opens a SharePoint page containing a Power BI web part report?

Quite simply, the content doesn’t show up.

Premium Capacity

However, on June 1, 2017, the premium pricing model for Power BI became available. Premium allows organizations to purchase premium capacity in the service. When reports are deployed to this premium capacity, users can access these reports without a Pro license. The act of publishing the report still requires a Pro license, but viewing it does not. Therefore, the Pro requirement for the web part goes away if the report is deployed to premium capacity.

This is in fact how it works. To date, I have seen no official announcement or post from Microsoft on this topic. The closest thing is a response to a forum post in the Power BI community forums:

“If the if the user that is trying to consume the embedded report does not have a Power BI Pro license but is part of a Power BI Premium instance, same viewer rights apply meaning that the user can view the report but collaboration features such as Analyze from Excel are not available, in line with regular Power BI Premium related features.”

The bottom line is that in most cases, all users, both producers and consumers will need a Power BI Pro license to be able to use the Power BI web part. The only time that this is not the case is when an organization has purchased premium capacity, and the report is deployed to that capacity. In that case, only the producer requires a Pro license. It should also be noted that in this case,  some features (like export data) will still not be available to the free users.

8 Comments