Skip to content

Category: Business Intelligence

Power BI Embedded is not for Embedding Power BI Reports

NOTICE Sept 17 2017 – The central thrust of this post is incorrect. I am leaving it here, because it still contains valid information, but for an update, please go to this article –  Which Premium SKU is Needed to embed Power BI Reports in SharePoint and Microsoft Teams

I have run into this point of confusion several times since the GA of the Power BI Premium SKU. As I mentioned in my post about licensing, the Power BI web part for SharePoint requires the user viewing the report to have a Pro license. Alternatively, if the organization has purchase Power BI premium capacity, and the report has been deployed to that capacity, then all organizational users will be able to view the report in the web part.

The initial announcement about Premium licensing laid out 5 different SKUs for premium, P1, P2 and P3. These SKUs are the “normal” SKUs that are intended to be used by Power BI customers. The “P” stands for Premium. Subsequently, 3 additional SKUs were announced at the Data Insights summit to be used by ISVs. These SKUs are EM1, EM2, and EM3. The “EM” stands for embedded. The embedded in this case means Power BI embedded. That’s where the confusion sets in.

Power BI Embedded is the ISV offering for Power BI. With Power BI embedded, software vendors can use Power BI as the reporting engine in their application. A number of vendors have taken advantage of this capability in the recent past including Nintex with their Hawkeye product, and ourselves with tyGraph for Yammer Reporting. With Power BI embedded, all of the processing for the application is done in the vendor’s Power BI tenant. Customers don’t require a Power BI license of any sort to use the applications. Recently, Power BI embedded has moved to a premium model as well, which is why the EM SKUs exist. They are for purchase by software vendors to power their own applications.

If we have a look at the pricing for each of these SKUs (in $US/month), we can see that the EM SKUs are significantly cheaper, but they also come with the important restriction that they can ONLY be used by ISVs.

Capacity Node Cores Back end cores Front end cores

Cost

P1 8 4 cores, 25 GB RAM 4 cores

$4,995

P2 16 8 cores, 50 GB RAM 8 cores

$9,995

P3 32 16 cores, 100 GB RAM 16 cores

$19,995

EM1 1 0.5 cores, 3 GB RAM 0.5 cores

$625

EM2 2 1 core, 5 GB RAM 1 core

$1,245

EM3 4 2 cores, 10 GB RAM 2 cores

$2,495

It may be natural to think that because your goal is to “embed” a Power BI report in SharePoint, that you will be able to use one of the cheaper, “embedded” SKUs. Microsoft loves to overload terms when they name things, and this is one of those times that this tendency leads to confusion. Make no mistake, in order to embed a Power BI report in a SharePoint page, and to have other users be able to view it, you will need to have a Pro license, and your users will either need Pro licenses as well, OR your organization will need to have purchased a Power BI Premium “P” SKU, not an “EM” SKU.

5 Comments

What License is Needed to Use the Power BI Web Part?

The Power BI web part is now a part of SharePoint online for the majority of Office 365 users. This web part allows Power BI reports to be embedded on SharePoint pages, putting them in greater context. These web parts are rendered on the client, not on the server like old style web parts, which means that they are rendered by the consuming user, not the server. This means that in order for the report to render properly, the user needs to not only have access to the report, but also needs to be licensed for it.

The Power BI web part is a feature that requires a Pro license for both producers and consumers. This actually makes sense given that any sharing features in Power BI require Pro. Also, given that the consuming user must have access to the report, the report will be contained in a Group workspace, and Group workspaces themselves require a Pro license. So, what happens when a non Pro user opens a SharePoint page containing a Power BI web part report?

Quite simply, the content doesn’t show up.

Premium Capacity

However, on June 1, 2017, the premium pricing model for Power BI became available. Premium allows organizations to purchase premium capacity in the service. When reports are deployed to this premium capacity, users can access these reports without a Pro license. The act of publishing the report still requires a Pro license, but viewing it does not. Therefore, the Pro requirement for the web part goes away if the report is deployed to premium capacity.

This is in fact how it works. To date, I have seen no official announcement or post from Microsoft on this topic. The closest thing is a response to a forum post in the Power BI community forums:

“If the if the user that is trying to consume the embedded report does not have a Power BI Pro license but is part of a Power BI Premium instance, same viewer rights apply meaning that the user can view the report but collaboration features such as Analyze from Excel are not available, in line with regular Power BI Premium related features.”

The bottom line is that in most cases, all users, both producers and consumers will need a Power BI Pro license to be able to use the Power BI web part. The only time that this is not the case is when an organization has purchased premium capacity, and the report is deployed to that capacity. In that case, only the producer requires a Pro license. It should also be noted that in this case,  some features (like export data) will still not be available to the free users.

8 Comments

Power BI Time Values in the Browser are Different Than Those in the Desktop

Have you ever had this experience? You build up your Power BI report using Power BI Desktop, and then when you publish and view the same report in the service, the date/time values are off by a set number of hours. I certainly run into this often enough that it warrants a blog post.

That you’ll notice is that this offset corresponds with the difference between your time zone and UTC (Coordinated Universal Time), the universal time standard. Now, you’ll notice that I didn’t say GMT (Greenwich Mean Time) which many people take to be the time standard, but the difference is that UTC is a time standard, and GMT is a time zone. GMT observes daylight savings time, and UTC does not – it remains constant. In my case, my time zone is Eastern, which is 4 hours behind UTC in the summer, and 5 hours behind in the winter. It is always 5 hours behind GMT. This distinction becomes important as you’ll see.

Coming back to our problem, we will see this problem if we have used the Date/Time/Timezone property in a Power BI Query (or a Power Query in Excel). When one of these column types are converted to Date/Time, the value is automatically localized. The reason that we see the different values is that when it is localized in Power BI Desktop, the machine’s time zone is used to perform the conversion. When this conversion happens in the Power BI service, UTC is used, and this results in different times being used in the browser. This difference can easily throw of any measures that depend are based on time values.

Column as Date/Time/Timezone

Same column as Date/Time

Further complicating things is the fact that DAX (Power Pivot) has no concept of Date/Time/Timezone and all columns of that type are brought into the model without the automatic conversion to local. So, how do we deal with this discrepancy?

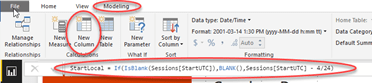
We can’t rely on the Power BI service to automatically show the viewer the correct time for the location they happen to be in, so we need to be specific about the time zone that we’re working with. In my case, I need to do this for my tyGraph for Twitter reports, like this one for Microsoft Ignite 2017, or most recently in this session browser for Ignite. For these types of reports, I adjust the times to match the time zone of the events themselves. To do this, I use the modelling capabilities in Power BI desktop to create a new calculated column in the same table that contains the UTC based date.

In DAX, time calculations are done in decimal fractions of a day. Therefore, to create a new column named StartLocal by subtracting 4 hours from a date/time column named StartUTC in a table named Sessions, the formula is:

StartLocal = Sessions[StartUTC]) - 4/24

If the source column contains null or blank values, they will be returned as 1899-12-30 4:00 AM using the formula above, so it’s a good idea to test for this case and return nulls when appropriate. The above formula then becomes:

StartLocal = If(IsBlank(Sessions[StartUTC]),BLANK(),Sessions[StartUTC] - 4/24)

This calculation will reliably return the time in Eastern Daylight Time (UTC -4) for a column that has UTC date/time values in both the Desktop and in the service. If all subsequent time calculations are based on this column, then it is a simple matter of substituting in the appropriate UTC time offset to the calculation above to show the time in a desired time zone.

It would be nice if the report would allow us to specify a “home” time zone with which to base all conversions on. Time zone could then be a property of the report. Until such a time as that happens, this should prove a suitable, if complicated workaround.

4 Comments

The Power BI Premium Pricing Model – The Good, The Bad and the Ugly

*Update – October 2017* – This post is still valid but more options are now available. I have another post outlining the changes here

On May 3, Microsoft announced sweeping changes to the pricing of Power BI by introducing a new “Power BI Premium” SKU. The announcement itself can be found here, and there a number of other related resources worth that I am listing here for convenience:

Distribute to large audiences with Power BI apps
Changes to Power BI embedded
Power BI Premium White Paper
Power BI Pricing
Premium pricing calculator
Introducing Power BI Report Server

Power BI Premium is intended to address deficiencies in the current pricing model primarily with respect to sharing content. In my opinion, the new model succeeds in this goal for the most part, but it leaves a significant number of customers behind, and it also leaves many unanswered questions. These problems need to be addressed for Power BI to succeed in its goal of bringing BI to the masses. Overall, I like what Microsoft is trying to do with this new pricing model, and with a few tweaks, I think that it can resonate.

First, we need to understand the new model, and to do that, we need to understand the former model and the need for Premium. Given that the former model (consisting of free and Pro licenses) has not been replaced (although it is changing significantly), we will refer to it as the original model, and when Premium is added to it, we will refer to that as the Premium model. The original model is still completely relevant moving forward.

The original model and the need for change

The original model is relatively simple, and relatively unique to the industry. Power BI users are licensed for either free or Pro features. If a report contains any Pro capabilities, any consuming user requires a Pro license. A free user can create a report that uses Pro features, but that same user will not be able to consume that report in the free service. This is a very important distinction to understand. The author of a report (using Power BI Desktop) could be a free user, use a Pro feature, and after deploying the report to the service, be unable to use it in the service.

Difference between free and Pro from a feature standpoint is no longer (as of this writing) available on the Power BI pricing page, however, prior to June 1, 2017 it is the list below.

Therefore, if a report is configured to be refreshed more than once per day, or even if the time of day is specified, or if the report uses on-premises data, then all users accessing that report require a Pro license. Given that Power BI is all about bringing Business Intelligence to the masses, when each one of those masses needs to pay $10/month, it tends to constrain adoption, particularly if a report’s audience is organization wide, and you are in a very large organization.

Report sharing is also relatively limited. Reports can be shared anonymously, which is insecure. Dashboards and their constituent reports can be shared either internally or externally, but they are read only. Finally, both dashboards and reports can be shared through Group workspaces (now app workspaces). Currently, Group workspaces do not allow for external sharing, but they are the preferred means of sharing. However, they too require Pro licenses, which constrains adoption. For the free user, anonymous and dashboard sharing are the only real options.

New model

The introduction of Power BI Premium aims to solve some of the sharing issues listed above, and therefore to help drive adoption. Premium capacity is an add on to a Power BI tenant (organization), and is different that free or Pro licenses which are assigned to users. An organization can purchase Premium capacity, and then a Pro user (this is restricted to Pro) can move or publish content to the Premium capacity. Once the content is in Premium storage, all users can utilize all the features in the dashboards and reports. Premium effectively removes all feature barriers from the reports.

Premium storage also brings many performance enhancements, such as the ability to refresh data up to 48 times per day (vs the previous 8), and the effective removal of data model size limits.

Without Premium, there are also several changes to the original licensing model. According to the May 3 Announcement FAQ on the Power BI community site:

Beginning June 1, the free service will have capabilities equivalent to Power BI Pro. This includes the same 1 GB workbook size limit, up to 8 daily scheduled refreshes for datasets, and maximum 1 million rows/hour streaming data rate. We’re also providing access to all data sources, including those available through the on-premises data gateway. Peer-to-peer dashboard sharing, group workspaces (now called app workspaces), export to PowerPoint, export to CSV/Excel, and analyze in Excel with Power BI apps are capabilities limited to Power BI Pro.”

Therefore, after June 1, 2017, Pro features are effectively an addition to the free features, and the feature differences should be as below:

From the May 3, 2017 announcement:

“Going forward, we will improve the free service to have the same functionality as Power BI Pro, but will limit sharing and collaboration features to only Power BI Pro users.”

The only features that Pro will have that free will not are those that are related to sharing. The above feature list reflects that.

Power BI Embedded

Power BI Embedded is the way that developers can embed Power BI in their applications. Using Power BI Embedded, until now, developers build reports, deploy them to their Azure instance, and call them from their applications. End users do not need any sort of Power BI licenses, and the developers are charged per report “render session”. This charging model has been one of the criticisms of Power BI embedded in that it is very difficult to predict costs. ISVs are at the mercy of the end users viewing reports, and any measure that is put into place to curb these render sessions is by definition a disincentive to adoption.

The fact that Embedded runs in a different namespace than the core Power BI service is another, leading to differences between the capabilities of Power BI Embedded and the core Power BI service. For example, the current iteration of Power BI Embedded cannot use the On-Premises Data Gateway, which can be quite restrictive.

Power BI Embedded is changing to use the new Premium capacity model. ISVs will purchase Premium capacity, and serve reports to their end users from that space. There will only be a single namespace for all Power BI content.

What’s Good

Power BI Premium solves to sharing problem for organizations that want to distribute their BI assets across the organization. If organizations would be accessing on premises data, a key feature of Power BI for enterprises, the Pro license requirement has discouraged adoption. With Premium capacity, an report publisher can share content with as many users as necessary without worrying about licensing the target users. Even better, those target users can be external, further extending the reach of that content.

For large enterprises, this has the potential to turn Power BI from a niche solution to something that is used by everyone.

The changes to the original model also makes things clearer for report designers and publishers. These publishers can work with the full range of Power BI features while the report is being built, and while they are themselves using it. When it comes time to share the report to a wider audience, they can publish it to Premium capacity where anyone can access it. If the organization has not purchased Premium, then the original model applies, and all recipients will still require a Pro license.

On the Power BI Embedded side, switching to Premium capacity completely eliminates the unpredictability of the current model. The fact that the reports will be rendered from the core Power BI service means that it will be fully on par with other Power BI reports, and developers will be able to take advantage of the full spectrum of Power BI features as they appear in the service.

What’s not so good

If you are a large company, there is very little not to like with this new model. It was large organizations that felt most of the pain with the original model, and it is they that benefit most from the Premium model. In fact, in my opinion, they are the only ones that benefit from the Premium model. Well, they and organizations that have no sharing requirements. The issue here is cost.

The Premium pricing estimator can be found online, but at present, it boils down to this. The smallest block of capacity that can be purchased by an organization is “P1”. To publish content to Premium capacity, you must also have a Power BI Pro license. Therefore, the minimum cost of entry is $4,995 (P1) plus $9.99 (Pro) for a total of $5,004.99 per month. This is well out of the reach of most small to medium sized organizations. In fact, an organization needs to be larger that 500 users (and those would be active Power BI users) for Premium to begin to make sense from a licensing perspective. The model size limit removal and the increased refresh frequency are also compelling reasons to move to Premium, but it’s easy to see that Premium is only for larger organizations.

Compounding this issue for small to medium sized organizations is the fact that as of June 30, dashboard sharing has been removed from the free SKU of the original pricing model. Any dashboards that had previously been shared broadly to free users will cease to function as of the cut-off date. If Premium does not make sense for these organizations, then they do have the option of purchasing Pro for the consumer. To help ease this transition, Microsoft is offering a year’s worth of Power BI Pro to all active free users that signed up prior to May 3, 2017.

However, dashboards can be shared with external users, and it’s a pretty tall order to expect an external user to subscribe to Pro just to be able to read your report.

With Power BI Embedded switching to the Premium model, the ISV now needs to buy Premium capacity. Given that the entry price for Premium is so high, it is (in my opinion) out of reach of most of the services that would rely on it, not to mention those developers that simply want to get up to speed on it or do some testing. There has recently been some indications on the forums that the barrier to entry won’t be as high for developers, but even a figure as low at $600/month may still be too high for many to swallow.

Conclusions

Overall, I think that the Premium pricing model solves a problem that desperately needed to be solved. This approach opens the door to Power BI truly democratizing Business Intelligence and becoming almost as ubiquitous as Excel. The opening up of features to the free SKU and focusing the Pro SKU on sharing means less confusion for report designers.

Unfortunately, for the moment price stands in the way of that goal of many small-medium sized businesses. These businesses may be small in stature, but they are many in number. The removal of sharing from the free SKU actually represents a step backward for them. The floodgates have been opened for large businesses, but the stream has been dammed for smaller ones.

Fortunately, pricing is a simple problem to solve. My hope is that the entry point for Premium comes down to something that would make sense for even a 10-person company, and that the cost for developers using Embedded could scale with far more elasticity, starting at $0 to encourage investment. These changes would, in my opinion, truly set the stage for Power BI dominance.

17 Comments

The Difference Between Reporting and Analytics is 42

In his novel “The Hitchhiker’s Guide to the Galaxy”, Douglas Adams envisioned a giant supercomputer named “Deep Thought” that was built to solve the answer to the ultimate question of life, the universe and everything. For the 5 people out there that are unfamiliar with the story, I’ll relate the important bits here. Deep Thought was commissioned by a race of pan-dimensional beings and required seven and a half million years to complete its calculations. When it was finally complete, Deep Thought informed the descendants of the original creators that the answer was 42. The receivers were understandably disappointed with this response, and when they questioned Deep Thought further, the computer postulated that perhaps the problem was that they never really knew what the question was.

Undeterred, the race then commissioned a second computer (which happened to be the Earth) that would calculate the ultimate question. After a couple of 10 million year attempts, the ultimate question was determined to be “What do you get when you multiply six by nine”. Of course, Adams never claimed that the universe made sense.

To my mind, this is an excellent demonstration of the difference between reporting and analytics. The accurate answer (report) provided a result, but not meaning. Further analytics were necessary to determine context.

Like many information technology terms (Big Data, machine learning, CRM) Business Intelligence (BI) is one of those umbrella terms that many people use regularly without fully understanding its meaning. BI is comprised of many tools that help to glean information and insights from raw data. Thus, an ETL package that moves data from one location to another is just as much a BI tool as is a fancy looking infographic. Combine this lack of clarity with the overloading of the term “reporting, and we wind up with some real confusion in this space.

Reporting is the process of using data to highlight things or trends that have already happened. This can be contrasted with monitoring, which does the same for things that are happening now, and predictive analytics, which tries to predict what will happen in the future based on the same data. The difference between reporting and monitoring is only one of data latency, and as such, monitoring is often referred to as real time reporting, which further muddies the water. However, for the purposes of this article, I want to focus on historical reporting.

Reports are typically one of two types, either operational or analytical. Tools that are good at producing one type are typically not so good at producing the other. What’s the difference? Operational reports are designed to provide information that we know we need, and analytical reports are designed to help us discover things that we didn’t know, or to help answer unanticipated questions. Operational reports are typically designed to be printed. They are typically well paginated, pixel perfect, and provide a single view of the data within any given report. Analytical reports are just the opposite. They are designed with visuals as a starting point, but allow for the ability to pivot on or drill down into the data as appropriate to answer ad-hoc questions. Printing is typically a weakness for analytical reports, whereas drilldown is a weakness for operational reports.

Both report types have their place but they both have very different design point. The data that backs an operational report should ideally be relatively flat, as that best reflects the report layout and helps with performance. Conversely, cubes and data models exist simply because a flat data structure does not adequately support analytical reporting. With analytical reporting, a user may at any point decide to view quantitative data (a measure) through the lens of a different facet (dimension). This difference is so great, that we need a different type of engine to support it. OLAP cubes and tabular models are both examples of this.

Another difference is the data that is necessary to support both report types. Operational reports tend to concern themselves with various levels of subtotals per the predefined facets. In a case like that, the data mart that backs the report only needs to store those subtotals. The granularity, or resolution of the data stored in the data mart does not need to exceed that of report that references it. Analytical reporting is different. Since users will be expected to drill down on data, from on dimension to another, or to filter the data according to increasingly granular facets, it is critical to store all of the data in the data mart backing the data model. We don’t know the level of resolution the analyst will need; therefore, all detail is required.

As a simple example of this, consider the case where we want to analyze some server log data over a period of time. We can pre-aggregate the data in the data model such that it stores the total of the log entries of various entries on a daily basis. There would need to be a total based on each dimension, but the overall data storage would be less than for the raw data. Such data would allow an analyst to spot trends over several days, but the decrease in resolution means that it will be impossible to spot any usage trends within a given day. If daily trends will never be necessary, then this doesn’t matter, but the nature of analytical reports means that the designer can never be sure.

The more that the source data for the report is pre-aggregated, the less that report becomes analytical in nature, and the more it approaches operational. This is regardless of the tool used; you can build either report type with any tool, it’s just that it may not be optimal.

The issue here is one of semantics. Semantics however are important in knowing what you are getting if reports are being provided to you. Calling something “Analytics” does not make it so. If you spin up a content pack in Power BI, and find that the underlying data model provides just enough dimensions and measure to construct the provided report, and that you can’t deconstruct the data in any meaningful way, what you have is a report, not analytics, no matter what the platform. As with anything, there is a trade-off between complexity and power. Given the nuances of this topic, it’s important to look under the hood to know what you are getting.

The answer “42” is perfectly acceptable if you already knew that the question was “what is 6×9?”. But if you want to know why, that takes a little more digging. You’d also know that there might be a data problem…

3 Comments